.svg)
The challenge with traditional TV advertising is not being able to identify which users have actually seen a TV spot. There is no deterministic method to match a user who has seen a TV spot to her interactions on the advertiser’s website. Technically speaking, in the TV domain, there isn’t a unique identifier (such as a cookie-id), that could be matched to a user who visited an app or website. Therefore statistical methods are being applied.
With programmatic and addressable TV advertising through OTT or streaming services, this gets easier, since more information about the TV ad viewer is trackable, e.g. the IP. Nevertheless, the challenge remains, that many people might see an ad on their TV but order the advertised product on another device, e.g. their laptop or mobile device. The advantage is, that cross-device tracking (from the addressable TV Ad to the device, where the purchase has been made) is a lot easier in this case. This is for example because the likelihood of both devices being in the same IP-net is much higher.
Generally speaking, there are two types of perspectives for evaluating the impact on sales and performance of TV advertising
The micro perspective – working on a User-level and tracking all touchpoints and interactions. Linking the airing of TV spots to visits and activities on the advertiser’s websites or apps and tracking. This approach allows assessing the impact TV has on the direct response of a user within the minutes directly after the TV spot. The assumption is, that seeing the TV ad drives the user to visit the advertiser’s website within the next couple minutes directly after the TV spot. This perspective doesn’t account for the longer lasting branding effects that a TV spot might have on a user, which might lead that user to visit the advertiser’s website e.g. two weeks after the TV spot.
The macro perspective – working with aggregated visits//lead/sales data for example on a daily weekly or monthly aggregation level. There is no need to directly map TV spots to Users. This analysis allows assessing the overall (direct response and branding) impact of TV ads. Methods such as marketing mix modeling and advanced time series forecasting can be applied here. The disadvantage of this method is that’s far less accurate and not applicable in all cases.
Depending on the product and the type of TV ads, branding or direct response orientated, one of the two methods are best used. There are also cases when a combination of both approaches might be useful, e.g. to understand the incremental impact TV has on branding.
In this post, the micro analysis approach will be explained.
Micro perspective – User based TV attribution
Generally speaking, this approach involves correlating the airing of a TV ad to a statistically significant lift in the number of visits per minute on the advertiser’s website. For this, all visits and visitors from SEO, SEA Brand and Direct are taken into account. Traffic from other sources, such as from retargeting campaigns or emails most likely isn’t directly caused by TV ads.
The biggest challenge is determining a baseline to understand how the number of visits would look like after a TV spot. Simply put, if this baseline is calculated to be 1000 visits per minute, and the actual number of visits per minute after a TV spot was 3000 visits, then it could be inferred, that 2000 visits were induced by that TV spot.
Adtriba calculates the baseline dynamically on a minute by minute basis, by using most current data from the times not impacted by TV ads. By comparing this baseline with the actual number of visitors, Adtriba’s TV attribution algorithm calculates whether there was a statistically significant uplift in the number of visits for any minute.
Special care is taken to ensure outliers and minutes where a significant lift was detected don’t skew the further baseline calculation. This rolling detection of statistically significant lifts allows for a dynamic setting of the numbers of minutes to be considered after the TV spot airing. Usually, TV Analytics providers always consider a static timeframe, for example, 4 minutes or 8 minutes, which can lead to over- or underestimating the performance of the TV commercials.
If for example a fixed window is set to 4 minutes, but the actual and measurable impact of the TV ad lasted for 7 minutes, all visits in the 5th to 7th minute, and later conversions from these visits, can’t be attributed to that TV spot.
")
Number of unique visitors per minute, baseline and peaks (signal)
In the above Diagram, every minute with a significant peak is annotated with the label "Signal". The green line shows the dynamically calculated baseline. At 21:01 a TV spot was aired, in minute 21:02 the baseline was 3 unique visits per minute, the actual number of visits was 111. That results in a lift of 36 (=(111-3)/3 and a 97.3% (=108/111) probability of every visitor on the advertiser’s website in minute 21:02 visiting because of that TV spot. If any of these 111 visitors orders in the future, we can attribute 97.3% of that sale to this particular TV spot. For example, if there are 20 orders from these 111 visitors in the future, we can attribute 19 to this TV spot.
Only including minutes with statistically significant lifts for TV attribution is crucial. Otherwise, an overestimation of spots running on smaller (in terms of reach and GRP) TV stations with a higher frequency is very likely. Users with a high probability to convert and purchase tend to have more visits on the advertiser’s website per se, for example, because they research details about the product. A spot that’s being aired 10 times an hour on a small TV station has a higher likelihood of being shown in the minutes directly before a visit of a purchasing user, compared to a spot being shown on a large TV station once per hour. If the significance of the lift isn’t accounted for these factors can lead to a small station being credited with too many conversions.
It’s also important to not set a static baseline, e.g. by calculating the median, or worse the mean of the numbers of visits in the time period or month before the TV airings started. This could lead to overvaluing the impact of TV ads significantly. Besides having a direct impact on the number of visitors to the advertiser’s website right after the spot, TV ads lift the overall level of the number of visits. Not accounting for this would overestimate the impact of a single TV ad. For example, a TV campaign has started in February and Spot A is being aired at 3 pm on the 10th of March and there’s a significant lift resulting in 1200 visits at 3:01 pm. The median number of visits before the beginning of the TV campaign in February was 500 visits per minute. The dynamic baseline is actually 800 visits at 2:59 pm. The fixed median method would result in 700 incremental visits, whereas the dynamic approach would attribute 400 visits to that spot.
Attribution for overlapping TV spots
For overlapping TV spots the lift pattern of each single TV spot, i.e. when it appears without an overlap to another spot, will be used for a weighted distribution of the lift between spots. For example, Spot A is being aired at 3 pm with a following significant lift in the number of visitors for the next minutes. Spot B is being aired at 3:03 pm, also being followed by a significant lift for the next minutes.
The uplift patterns for Spot A and Spot B, when being aired without any overlaps, are shown in the below table:

Table 1 – Average lift per minute after spot airing
Example table 1:
on average the visitor lift in minute 4 after Spot A has been aired is 9. So if the baseline is 20 visits per minute, on average over all past airings of Spot A there are 200 (= (lift+1)*baseline) visits per minute.

Table 2 – Visitor and visit probability attribution for overlapping spots
Example table 2:
- At 3:04 PM, minute 5 after the airing of Spot A (average lift of 8, see table 1)
- and minute 2 after airing of Spot B (average lift of 9),
- there are 155-20 = 135 additional visits,
- of which 8/(8+9) = 47% (64) are being attributed to Spot A
- and 9/(8+9)= 53% (71) to Spot B.
- This results in a 41% (=64/135) probability of every user coming to the website at 3:04 PM because of Spot A (46% for Spot B respectively).
Now that we have an estimate of how likely it is, that a visitor has seen the TV spot and visited the website because of the spot, we can use that probability in two ways.
Isolated TV attribution
The first one is estimating the impact of the TV spots in an isolated manner, without taking into account other marketing touchpoints. This is what most existing TV analytics solutions, TV stations and agencies provide. This method holds the danger of overvaluing the impact of TV because other marketing touchpoints aren’t accounted for.
To estimate the number of conversions that should be credited to a specific TV spot this way, all users visiting the website after that TV spot in minutes with significant lifts will be flagged as belonging to that Spot cohort. If a user from that cohort orders a product, that order is attributed to that TV spot, weighted with the probability that this user actually came through that TV spot. Here’s an example based on the data from table 2: Let’s assume from all the 155 users visiting the website at 3:05 pm 10 users complete an order sometime later. Then 2.5 (25%) of these orders would be attributed to Spot A, and 6.3 to Spot B. Similarly this is done for all minutes with significant lifts following airings of Spot A, to calculate the overall conversion attribution for Spot A. If a user has visits after more than one TV spot, one on Monday, another one on Tuesday, than the attribution split would be done accordingly, based on the lift-weights of each spot when being aired without overlaps to other spots.
Integrated and cross-channel TV attribution
The second approach is to integrate the potential TV ad touchpoints on a user level into the user journey analysis and attribution modeling. This has the advantage of evaluating the effectiveness of TV ads in a holistic cross-channel context. Through the calculations described above, we know for every user, visiting the advertiser’s website, what the probability is, that she came because of the TV spot. Following the example above from table 2, let’s assume a user visited the website at 3:03 pm. Then there’s a 45% probability she visited because of Spot A and a 40% probability she visited because of Spot B. These two potential TV ad views are being integrated into the user journey of this particular user. So if this user had a following Paid Search Click, added something into the basket and then eventually purchased the product right after click on a retargeting campaign, her particular user journey would look as follows:

User Journey with two potential and weighted TV ad views
Having TV ad touchpoints integrated into the user journey analysis delivers insights into what other marketing touchpoints are part of a user’s journey, that might be influenced by TV campaigns. This allows understanding, for example in which digital marketing campaigns spend needs to be increased if the traffic from a specific TV station should be optimally converted. It enables Adtriba’s clients to analyze the interplay between TV ads and digital marketing channels on a user journey and detailed level.
Combining user-level TV attribution with Adtriba’s CLV attribution capabilities is particularly interesting for TV advertisers. This allows for not only assessing the impact of TV ads on first orders but also on CLV. For example, one TV station could successfully drive additional first orders but fails to attract users that purchase repeatedly, versus another TV station that attracts less new clients, but generates higher CLVs through better attracting repeat buyers. Being able to see this kind of TV attribution analysis is crucial for a holistic performance optimization of TV ads.
The following diagrams from the Adtriba dashboard are examples of the type of analysis that is possible through this integrated approach:
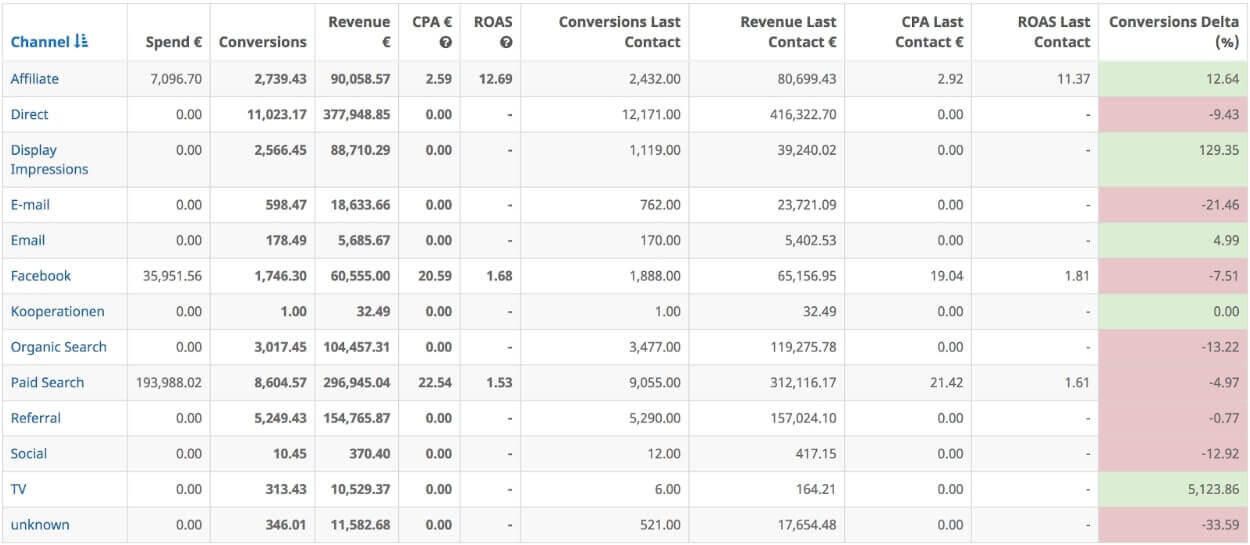
Adtriba performance report including TV as a channel comparable to other channels

Adtriba customer journey analysis: journeys with a TV ad view as first interaction

Adtriba funnel analysis: in what part of the customer journey funnel do TV ad views occur
Adtriba allows analyzing TV ad performance in both ways, the integrated and isolated way. Usually, the integrated approach should be prefered, but for comparison with existing tools or what the TV agencies or stations report, we also offer the isolated perspective.